Grouping data
The ability to group rows and columns as well as create an outline allows you to make it easier to work with a spreadsheet that contains a large amount of data. In the Spreadsheet Editor, you can collapse or expand grouped rows and columns to display the necessary data only. It's also possible to create the multi-level structure of grouped rows/columns. When necessary, you can ungroup the previously grouped rows or columns.
Group rows and columns
To group rows or columns:
- Select the cell range that you need to group.
-
Switch to the Data tab and use one of the necessary options on the top toolbar:
-
click the
 Group button, then choose the Rows or Columns option in the Group window that appears and click OK,

- click the downwards arrow below the Group button and choose the Group rows option from the menu,
- click the downwards arrow below the Group button and choose the Group columns option from the menu.
-
click the
The selected rows or columns will be grouped, and the created outline will be displayed to the left of the rows or/and above the columns.
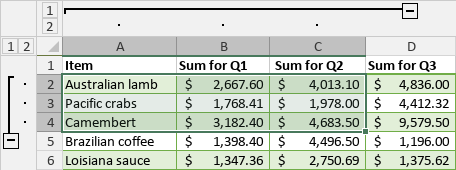
To hide grouped rows/columns, click the  Collapse icon. To show collapsed rows/columns, click the
  Expand icon.
Change the outline
To change the outline of grouped rows or columns, you can use options from the Group drop-down menu. The Summary rows below detail and Summary columns to the right of detail options are checked by default. They allow changing the location of the Collapse and Expand buttons:
- Uncheck the Summary rows below detail option if you want to display the summary rows above the details.
- Uncheck the Summary columns to right of detail option if you want to display the summary columns to the left of details.
Create multi-level groups
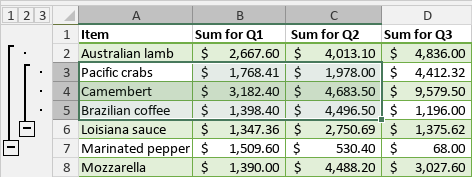
To create a multi-level structure, select a cell range within the previously created group of rows/columns, and group the newly selected range as described above. After that, you can hide and show groups by level using the icons with the level number:  .
.
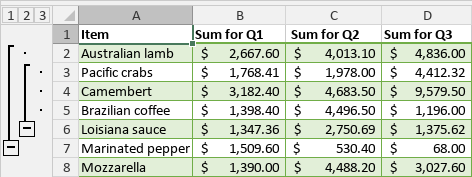
For example, if you create a nested group within the parent group, three levels will be available. It's possible to create up to 8 levels.
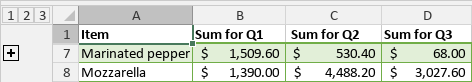
-
Click the first level
 icon to switch to the level which hides all grouped data:
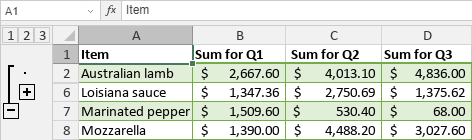
-
Click the second level
 icon to switch to the level which displays details of the parent group, but hides the nested group data:
-
Click the third level
 icon to switch to the level which displays all details:
It's also possible to use the Collapse and Expand icons within the outline to display or hide the data corresponding to a certain level.
Ungroup previously grouped rows and columns
To ungroup previously grouped rows or columns:
- Select the range of grouped cells that you need to ungroup.
-
Switch to the Data tab and use one of the necessary options at the top toolbar:
-
click the
 Ungroup button, then choose the Rows or Columns option in the Group window that appears and click OK,
- click the downwards arrow below the Ungroup button, then choose the Ungroup rows option from the menu to ungroup rows and clear the outline of rows,
- click the downwards arrow below the Ungroup button and choose the Ungroup columns option from the menu to ungroup columns and clear the outline of columns,
- click the downwards arrow below the Ungroup button and choose the Clear outline option from the menu to clear the outline of rows and columns without removing existing groups.
-
click the