Editing chart elements
Edit chart elements
To edit the chart Title, select the default text with the mouse and type in your own one instead.
To change the font formatting within text elements, such as the chart title, axes titles, legend entries, data labels etc., select the necessary text element by left-clicking it. Then use icons on the Home tab of the top toolbar to change the font type, style, size, or color.
When the chart is selected, the Shape settings  icon is also available on the right, since the shape is used as a background for the chart. You can click this icon to open the Shape settings tab on the right sidebar and adjust the shape Fill and Line. Note that you cannot change the shape type.
Using the Shape settings tab on the right panel you can not only adjust the chart area itself, but also change the chart elements, such as the plot area, data series, chart title, legend, etc. and apply different fill types to them. Select the chart element by clicking it with the left mouse button and choose the preferred fill type: solid color, gradient, texture or picture, pattern. Specify the fill parameters and set the Opacity level if necessary. When you select a vertical or horizontal axis or gridlines, the stroke settings are only available on the Shape Settings tab: color, width, type, and opacity. For more details on how to work with shape colors, fills and stroke, please refer to this page.
The Show shadow option is also available on the Shape settings tab, but it is disabled for chart elements.
If you need to resize chart elements, left-click to select the needed element and drag one of 8 white squares  located along the perimeter of the element.

To change the position of the element, left-click on it, make sure your cursor changed to  , hold the left mouse button and drag the element to the needed position.

To delete a chart element, select it by left-clicking and press the Delete key on the keyboard.
You can also rotate 3D charts using the mouse. Left-click within the plot area to select it, then hold the mouse button. Drag the cursor without releasing the mouse button to change the 3D chart orientation.
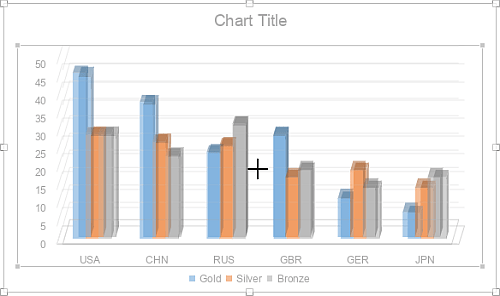
If necessary, you can change the chart size and position.
To delete the inserted chart, click it and press the Delete key.
To adjust which chart elements are displayed, click the  button in the top right corner of the inserted chart and check or uncheck the elements you want to show or hide.
