Chart advanced settings
To change the chart advanced settings, click the Advanced settings button on the Chart Design tab. The Chart — Advanced Settings window will open.
Layout

The Layout tab allows you to change the layout of chart elements.
-
Specify the Chart title position in regard to your chart by selecting the necessary option from the drop-down list:
- None to display no chart title,
- Overlay to overlay and center the title in the plot area,
- No overlay to display the title above the plot area.
-
Specify the Legend position in regard to your chart by selecting the necessary option from the drop-down list:
- None to display no legend,
- Bottom to display the legend and align it to the bottom of the plot area,
- Top to display the legend and align it to the top of the plot area,
- Right to display the legend and align it to the right of the plot area,
- Left to display the legend and align it to the left of the plot area,
- Left overlay to overlay and center the legend to the left in the plot area,
- Right overlay to overlay and center the legend to the right in the plot area.
-
Specify the Data labels (i.e., text labels that represent exact values of data points) parameters:
-
Specify the Data labels position relative to the data points by selecting the necessary option from the drop-down list. The available options vary depending on the selected chart type.
- For Column/Bar charts, you can choose the following options: None, Center, Inner bottom, Inner top, Outer top.
- For Line/XY (Scatter)/Stock charts, you can choose the following options: None, Center, Left, Right, Top, Bottom.
- For Pie charts, you can choose the following options: None, Center, Fit to width, Inner top, Outer top.
- For Area charts as well as for 3D Column, Line, Radar, and Bar charts, you can choose the following options: None, Center.
-
Select the data you wish to include into your labels, checking the corresponding boxes: Series name, Category name, Value,
-
Enter a character (comma, semicolon, etc.) you wish to use for separating several labels into the Data labels separator entry field.
-
-
Lines — is used to choose a line style for Line/XY (Scatter) charts. You can choose one of the following options: Straight to use straight lines between data points, Smooth to use smooth curves between data points, or None to not display lines.
-
Markers — is used to specify whether the markers should be displayed (if the box is checked) or not (if the box is unchecked) for Line/XY (Scatter) charts.
noteThe Lines and Markers options are available for Line charts and XY (Scatter) charts only.
-
Trendline options — use the Display equation on chart option for the equations to appear on the diagram.
noteThis option is available for diagrams that include trendlines.
Vertical axis
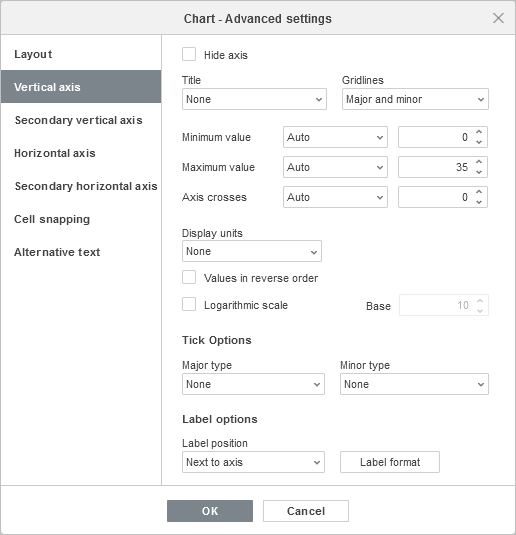
The Vertical axis tab allows you to change the parameters of the vertical axis also referred to as the values axis or y-axis which displays numeric values. Note that the vertical axis will be the category axis which displays text labels for the Bar charts, therefore in this case the Vertical axis tab options will correspond to the ones described in the next section. For the XY (Scatter) charts, both axes are value axes.
The Axis settings and Gridlines sections will be disabled for Pie charts, since charts of this type have no axes and gridlines.
-
Select Hide to hide vertical axis in the chart, leave it unchecked to have vertical axis displayed.
-
Specify Title orientation by selecting the necessary option from the drop-down list:
- None to display no vertical axis title,
- Rotated to display the title from bottom to top to the left of the vertical axis,
- Horizontal to display the title horizontally to the left of the vertical axis.
-
Minimum value — is used to specify the lowest value displayed at the vertical axis start. The Auto option is selected by default, in this case the minimum value is calculated automatically depending on the selected data range. You can select the Fixed option from the drop-down list and specify a different value in the entry field on the right.
-
Maximum value — is used to specify the highest value displayed at the vertical axis end. The Auto option is selected by default, in this case the maximum value is calculated automatically depending on the selected data range. You can select the Fixed option from the drop-down list and specify a different value in the entry field on the right.
-
Axis crosses — is used to specify a point on the vertical axis where the horizontal axis should cross it. The Auto option is selected by default, in this case the axes' intersection point value is calculated automatically depending on the selected data range. You can select the Value option from the drop-down list and specify a different value in the entry field on the right, or set the axes' intersection point at the Minimum/Maximum Value on the vertical axis.
-
Display units — is used to determine the representation of the numeric values along the vertical axis. This option can be useful if you're working with great numbers and wish the values on the axis to be displayed in a more compact and readable way (e.g. you can represent 50 000 as 50 by using the Thousands display units). Select desired units from the drop-down list: Hundreds, Thousands, 10 000, 100 000, Millions, 10 000 000, 100 000 000, Billions, Trillions, or choose the None option to return to the default units.
-
Values in reverse order — is used to display values in the opposite direction. When the box is unchecked, the lowest value is at the bottom and the highest value is at the top of the axis. When the box is checked, the values are ordered from top to bottom.
-
Logarithmic scale — is used to enable logarithmic scaling to the Base that is determined by the user.
-
The Tick Options section allows adjusting the appearance of tick marks on the vertical scale. Major tick marks are the larger scale divisions, which can have labels displaying numeric values. Minor tick marks are the scale subdivisions, which are placed between the major tick marks and have no labels. Tick marks also define where gridlines can be displayed if the corresponding option is set on the Layout tab. The Major/minor type drop-down lists contain the following placement options:
- None to display no major/minor tick marks,
- Cross to display major/minor tick marks on both sides of the axis,
- In to display major/minor tick marks inside the axis,
- Out to display major/minor tick marks outside the axis.
-
The Label options section allows adjusting the appearance of major tick mark labels which display values. To specify a Label position in regard to the vertical axis, select the necessary option from the drop-down list:
-
None to display no tick mark labels,
-
Low to display tick mark labels to the left of the plot area,
-
High to display tick mark labels to the right of the plot area,
-
Next to axis to display tick mark labels next to the axis.
-
To specify a Label format, click the Label format button and choose a category as deemed appropriate.
Available label format categories:
- General
- Number
- Scientific
- Accounting
- Currency
- Date
- Time
- Percentage
- Fraction
- Text
- Custom
Label format options vary depending on the selected category. For more information on changing number format, go to this page.
-
Check Linked to source to keep number formatting from the data source in the chart.
-
Secondary axes
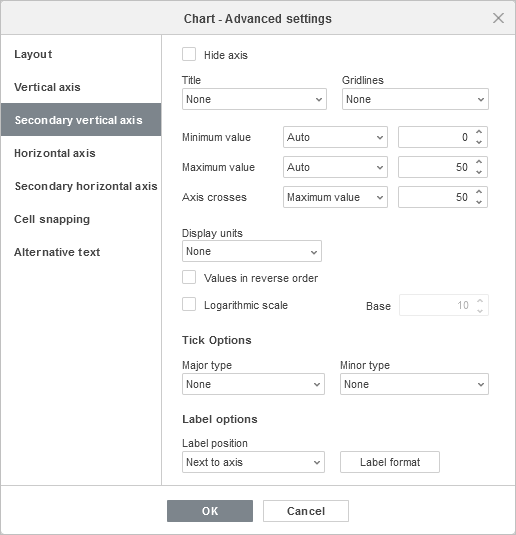
Secondary axes are supported in Combo charts only.
Secondary axes are useful in Combo charts when data series vary considerably or mixed types of data are used to plot a chart. Secondary Axes make it easier to read and understand a combo chart.
The Secondary vertical/horizontal axis tab appears when you choose an appropriate data series for a combo chart. All the settings and options on the Secondary vertical/horizontal axis tab are the same as the settings on the Vertical/Horizontal Axis. For a detailed description of the Vertical/horizontal axis options, see description above/below.
Horizontal axis
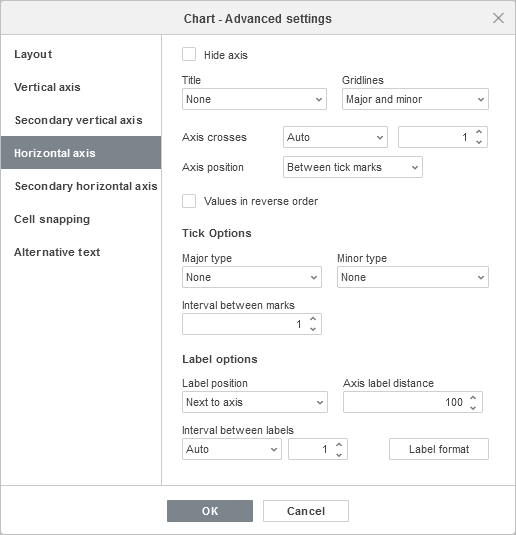
The Horizontal axis tab allows you to change the parameters of the horizontal axis also referred to as the categories axis or x-axis which displays text labels. Note that the horizontal axis will be the value axis which displays numeric values for the Bar charts, therefore in this case the Horizontal axis tab options will correspond to the ones described in the previous section. For the XY (Scatter) charts, both axes are value axes.
-
Select Hide to hide horizontal axis in the chart, leave it unchecked to have horizontal axis displayed.
-
Specify Title orientation by selecting the necessary option from the drop-down list:
- None when you don't want to display a horizontal axis title,
- No overlay to display the title below the horizontal axis.
-
Gridlines is used to specify the Horizontal gridlines to display by selecting the necessary option from the drop-down list: None, Major, Minor, or Major and minor.
-
Axis crosses — is used to specify a point on the horizontal axis where the vertical axis should cross it. The Auto option is selected by default, in this case the axes' intersection point value is calculated automatically depending on the selected data range. You can select the Value option from the drop-down list and specify a different value in the entry field on the right, or set the axes' intersection point at the Minimum/maximum value (that corresponds to the first and last category) on the horizontal axis.
-
Axis position — is used to specify where the axis text labels should be placed: On tick marks or Between tick marks.
-
Values in reverse order — is used to display categories in the opposite direction. When the box is unchecked, categories are displayed from left to right. When the box is checked, the categories are ordered from right to left.
-
The Tick Options section allows adjusting the appearance of tick marks on the horizontal scale. Major tick marks are the larger divisions, which can have labels displaying category values. Minor tick marks are the smaller divisions which are placed between the major tick marks and have no labels. Tick marks also define where gridlines can be displayed if the corresponding option is set on the Layout tab. You can adjust the following tick mark parameters:
- Major/minor type — is used to specify the following placement options: None to display no major/minor tick marks, Cross to display major/minor tick marks on both sides of the axis, In to display major/minor tick marks inside the axis, Out to display major/minor tick marks outside the axis.
- Interval between marks — is used to specify how many categories should be displayed between two adjacent tick marks.
-
The Label options section allows adjusting the appearance of labels which display categories.
-
Label position — is used to specify where the labels should be placed in regard to the horizontal axis. Select the necessary option from the drop-down list: None to display no category labels, Low to display category labels at the bottom of the plot area, High to display category labels at the top of the plot area, Next to axis to display category labels next to the axis.
-
Axis label distance — is used to specify how closely the labels should be placed to the axis. You can specify the necessary value in the entry field. The more the value you set, the more the distance between the axis and labels is.
-
Interval between labels — is used to specify how often the labels should be displayed. The Auto option is selected by default, in this case labels are displayed for every category. You can select the Manual option from the drop-down list and specify the necessary value in the entry field on the right. For example, enter 2 to display labels for every other category, etc.
-
To specify a Label format, click the Label format button and choose a category as deemed appropriate.
Available label format categories:
- General
- Number
- Scientific
- Accounting
- Currency
- Date
- Time
- Percentage
- Fraction
- Text
- Custom
Label format options vary depending on the selected category. For more information on changing number format, go to this page.
-
Check Linked to source to keep number formatting from the data source in the chart.
-
Cell snapping
The Cell snapping tab contains the following parameters:
- Move and size with cells — this option allows you to snap the chart to the cell behind it. If the cell moves (e.g., if you insert or delete some rows/columns), the chart will be moved together with the cell. If you increase or decrease the width or height of the cell, the chart will change its size as well.
- Move but don't size with cells — this option allows you to snap the chart to the cell behind it preventing the chart from being resized. If the cell moves, the chart will be moved together with the cell, but if you change the cell size, the chart dimensions remain unchanged.
- Don't move or size with cells — this option allows you to prevent the chart from being moved or resized if the cell position or size was changed.

Alternative text
The Alternative text tab allows you to specify the Title and the Description which will be read to people with vision or cognitive impairments.
