Adjusting chart settings
Adjust chart settings
When a chart is selected, the Chart Design tab becomes available on the top toolbar. Use it to adjust the chart appearance and settings.

-
Chart Elements — click to show or hide individual chart elements: Chart title, Data labels, and Legend.
-
Edit Data — click to open the Chart Editor window and modify the chart data.
-
Chart designs — choose a design from the icon list to apply a preset style to the chart. Click the arrow to expand the list and see all available designs.
-
Chart type — click to change the selected chart type and style.
When you choose Combo Charts, the Chart type window lists chart series and allows choosing the types of charts to combine and selecting data series to place on a secondary axis.

-
Advanced settings — click to open the Chart — Advanced Settings window. See the detailed description below.
-
Wrapping — click to select a text wrapping style from the available ones: inline, square, tight, through, top and bottom, in front, behind.
-
Width and Height — use these fields to set the chart dimensions manually.
-
Lock aspect ratio — enable this option to preserve the original proportions of the chart when resizing.
When a 3D chart type is selected, the 3D Rotation button also appears on the Chart Design tab:
-
X rotation — set the required value for the X axis rotation using the keyboard or via the Left and Right arrows to the right.
-
Y rotation — set the required value for the Y axis rotation using the keyboard or via the Up and Down arrows to the right.
-
Perspective — set the required value for depth rotation using the keyboard or via the Narrow field of view and Widen field of view arrows to the right.
-
Right Angle Axis — is used to set the right angle axis view.
-
Autoscale — check this box to autoscale the depth and height values of the chart, or uncheck this box to set the depth and height values manually.
-
Depth (% of base) — set the required depth value using the keyboard or via the arrows.
-
Height (% of base) — set the required height value using the keyboard or via the arrows.
-
Default Rotation — set the 3D parameters to their default.
notePlease note that you cannot edit each element of the chart; the settings will be applied to the chart as a whole.
To quickly open the Chart Editor window, you can also double-click the chart in the document.
You can also find some of these options in the right-click menu. The menu options are:
- Cut, Copy, Paste — standard options which are used to cut or copy the selected text/object and paste the previously cut/copied text passage or object to the current cursor position.
- Arrange is used to bring the selected chart to the foreground, send it to the background, move forward or backward, as well as group or ungroup charts to perform operations with several of them at once. To learn more on how to arrange objects, please refer to this page.
- Align is used to align the chart left, center, right, top, middle, bottom. To learn more on how to align objects, you can refer to this page.
- Wrapping Style is used to select a text wrapping style from the available ones — inline, square, tight, through, top and bottom, in front, behind. The Edit Wrap Boundary option is unavailable for charts.
- Edit Data is used to open the Chart Editor window.
- Chart Advanced Settings is used to open the Chart — Advanced Settings window.
To change the chart advanced settings, click the Advanced settings button on the Chart Design tab, or right-click the chart and select Chart Advanced Settings from the right-click menu. The chart properties window will open:

The Size tab contains the following parameters:
- Width and Height — use these options to change the width and/or height of the chart. If the Constant Proportions
 button is clicked (in this case it looks like this
 ), the width and height will be changed together, preserving the original chart aspect ratio.

The Text Wrapping tab contains the following parameters:
-
Wrapping Style — use this option to change the way the chart is positioned relative to the text: it will either be a part of the text (in case you select the inline style) or bypassed by it from all sides (if you select one of the other styles).
-
 Inline — the chart is considered to be a part of the text, like a character, so when the text moves, the chart moves as well. In this case, the positioning options are inaccessible.
If one of the following styles is selected, the chart can be moved independently of the text and positioned on the page exactly:
-
 Square — the text wraps the rectangular box that bounds the chart.
-
 Tight — the text wraps the actual chart edges.
-
 Through — the text wraps around the chart edges and fills in the open white space within the chart.
-
 Top and bottom — the text is only above and below the chart.
-
 In front — the chart overlaps the text.
-
 Behind — the text overlaps the chart.
-
If you select the square, tight, through, or top and bottom styles, you will be able to set up some additional parameters — distance from text at all sides (top, bottom, left, right).
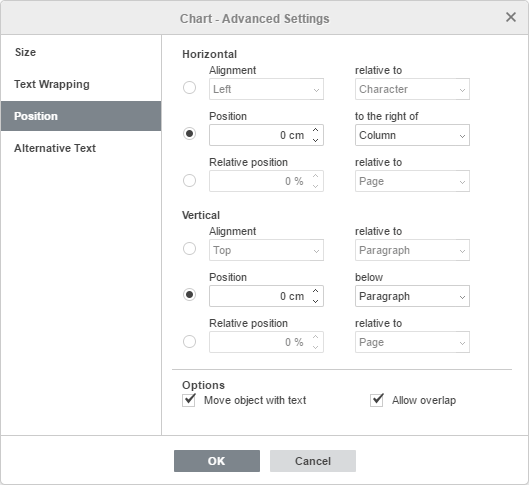
The Position tab is available only if the selected wrapping style is not inline. This tab contains the following parameters that vary depending on the selected wrapping style:
-
The Horizontal section allows you to select one of the following three chart positioning types:
- Alignment (left, center, right) relative to character, column, left margin, margin, page or right margin,
- Absolute Position measured in absolute units, i.e., Centimeters/Points/Inches (depending on the option specified on the File -> Advanced Settings... tab) to the right of character, column, left margin, margin, page or right margin,
- Relative position measured in percent relative to the left margin, margin, page or right margin.
-
The Vertical section allows you to select one of the following three chart positioning types:
- Alignment (top, center, bottom) relative to line, margin, bottom margin, paragraph, page or top margin,
- Absolute Position measured in absolute units, i.e., Centimeters/Points/Inches (depending on the option specified on the File -> Advanced Settings... tab) below line, margin, bottom margin, paragraph, page or top margin,
- Relative position measured in percent relative to the margin, bottom margin, page or top margin.
-
Move object with text ensures that the chart moves along with the text to which it is anchored.
-
Allow overlap makes it possible for two charts to overlap if you drag them near each other on the page.

The Alternative Text tab allows specifying a Title and Description which will be read to the people with vision or cognitive impairments to help them better understand what information the chart contains.