Inserting and editing charts
Insert a chart
To insert a chart in the Presentation Editor,
-
Put the cursor where you want to add a chart.
-
Switch to the Insert tab of the top toolbar.
-
Click the
 Chart icon on the top toolbar.
-
Select the needed chart type from the available ones:
Column Charts
- Clustered column
- Stacked column
- 100% stacked column
- 3-D Clustered Column
- 3-D Stacked Column
- 3-D 100% stacked column
- 3-D Column
Line Charts
- Line
- Stacked line
- 100% stacked line
- Line with markers
- Stacked line with markers
- 100% stacked line with markers
- 3-D Line
Pie Charts
- Pie
- Doughnut
- 3-D Pie
Bar Charts
- Clustered bar
- Stacked bar
- 100% stacked bar
- 3-D clustered bar
- 3-D stacked bar
- 3-D 100% stacked bar
Area Charts
- Area
- Stacked area
- 100% stacked area
Stock Charts
XY (Scatter) Charts
- Scatter
- Scatter with smooth lines and markers
- Scatter with smooth lines
- Scatter with straight lines and markers
- Scatter with straight lines
Radar Charts
- Radar
- Radar with markers
- Filled radar
Combo Charts
- Clustered column — line
- Clustered column — line on secondary axis
- Stacked area — clustered column
- Custom combination
noteONLYOFFICE Presentation Editor supports the following types of charts that were created with third-party editors: Pyramid, Bar (Pyramid), Horizontal/Vertical Cylinders, Horizontal/Vertical Cones. You can open the file containing such a chart and modify it using the available chart editing tools. The following types are supported for opening only: Histogram, Waterfall, Funnel, Explosion.
It is also possible to insert chart data from the Spreadsheet Editor. When you paste the copied data, click the paste options Ctrl button in the bottom right corner of the inserted chart:
- Keep source formatting and Link data (F) — the original formatting is preserved and the data is linked with the source file.
- Keep source formatting and Embed workbook (K) — the original formatting is preserved and the chart is embedded within the current file.
-
After that, the Chart Editor window will appear where you can enter the necessary data into the cells using the following controls:
 and
 for copying and pasting the copied data
 and
 for undoing and redoing actions
 for inserting a function
 and
 for decreasing and increasing decimal places
 for changing the number format, i.e., the way the numbers you enter appear in cells

-
Click the Select Data button situated in the Chart Editor window. The Chart data window will open.
-
Use the Chart data dialog to manage Chart data range, Legend entries (series), Horizontal (category) axis labels and Switch row/column.

-
Chart data range — select data for your chart.
-
Click the
 icon on the right of the Chart data range box to select the data range.

-
-
Legend entries (series) — add, edit, or remove legend entries. Type or select a series name for legend entries.
-
In Legend entries (series), click Add button.
-
In Edit series, type a new legend entry or click the
icon on the right of the Select name box.
-
-
Horizontal (category) axis labels — change the text for category labels.
-
In Horizontal (category) axis labels, click Edit.
-
In Axis label range, type the labels you want to add or click the
icon on the right of the Axis label range box to select the data range.
-
-
Switch row/column — rearrange the worksheet data that is configured in the chart not in the way that you want it. Switch rows to columns to display data on a different axis.
-
-
Click the OK button to apply the changes and close the window.
-
-
Click the Chart type button on the Chart Design tab to choose the chart type and style. Select a chart from the available sections: Column, Line, Pie, Bar, Area, Stock, XY (Scatter), Radar, or Combo.
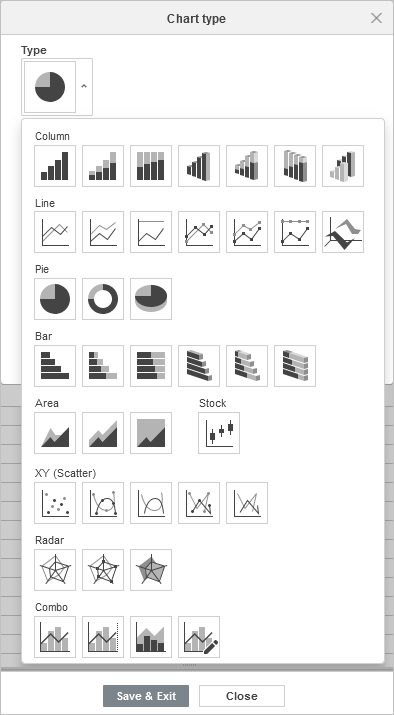
When you choose Combo Charts, the Chart type window lists chart series and allows choosing the types of charts to combine, as well as select data series to place on a secondary axis.

-
Change the chart settings by clicking the Advanced settings button on the Chart Design tab. The Chart — Advanced Settings window will open.
Its tabs are described on the Chart advanced settings page.
-
Once the chart is added, you can also change its size and position.
You can specify the chart position on the slide by dragging it vertically or horizontally.
You can also add a chart into a text placeholder by pressing the  Chart icon within it and selecting the necessary chart type:

It's also possible to add a chart to a slide layout. To learn more, please refer to this article.
Learn more about working with charts:
Chart advanced settings
Set the chart name, layout, axes, size, position and alternative text in the Chart — Advanced Settings window of the Presentation Editor.
Editing chart elements
Edit the title, text, fill, lines and other elements of a chart in the Presentation Editor and choose which elements to show.
Adjusting chart settings
Use the Chart Design tab to change the chart type, design, size and 3D rotation in the Presentation Editor.